China-Africa Trade Index Report
350
Published by
2023-08-30 15:17:30
China-Africa Trade Index Report
I. Overview of China-Africa Trade
Africa is one of the regions with rapid economic growth globally and has become a focal point for new global economic growth. Since the establishment of the "Forum on China-Africa Cooperation" in 2000, Sino-African economic and trade cooperation has entered a new stage of rapid, comprehensive, and stable development. The total value of goods trade has grown from 87.38 billion yuan in 2000 to 1.88 trillion yuan in 2022, with an average annual growth rate of 17.7%.
II. Introduction to the China-Africa Trade Index
To better showcase the achievements of China-Africa trade, tap into cooperation potential, and promote high-quality trade development, the General Administration of Customs initiated the compilation of the "China-Africa Trade Index" in 2022. The index, completed in May 2023 after expert review and acceptance in April 2023, was officially released on June 29, 2023, during the Third China-Africa Economic and Trade Expo. The index encompasses five dimensions of indicators: trade volume, trade intimacy, trade structure, trade potential, and subject vitality.
III. Presentation of the China-Africa Trade Index
Since 2000, the China-Africa Trade Index has shown a significant overall upward trend. It experienced some declines in 2015, 2016, and 2020 but resumed an upward trajectory, reaching a new high of 990.55 in 2022.
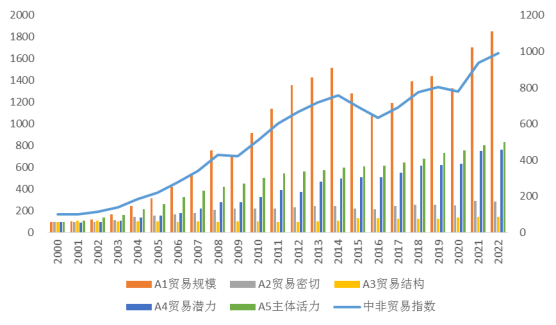
China-Africa Trade Index Results
Specific Index Details:
-
Trade Volume
- The trade volume indicator evaluates China's trade development with Africa from the perspective of trade imports and exports. It primarily includes trade total value and trade proportion. A higher value indicates a larger trade volume between China and Africa. The index reached its highest point in 2022 at 1855.16, with trade total value and trade proportion indicators reaching 2713.75 and 695.46, respectively.
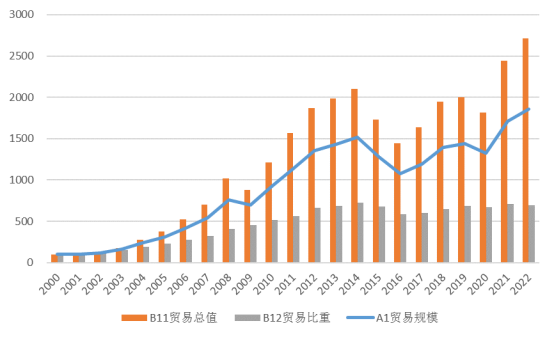
Trend chart of first-level indicator of trade scale
-
Trade Intimacy
- Trade intimacy reflects the closeness of bilateral trade in goods between China and Africa. It mainly includes trade connectivity and trade dependency. The trade intimacy indicator has been on an upward trajectory, signifying increasingly close trade relations between China and Africa. The lowest point occurred in 2001 at 95.74, while the highest point was in 2021 at 293.05. In 2022, it slightly decreased but remained high at 286.80. The trade connectivity and trade dependency indicators reached 160.51 and 344.40, respectively.
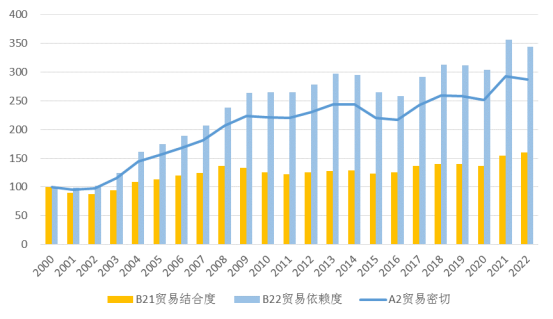
Trend chart of the first level indicator of trade closeness
-
Trade Structure
- Trade structure reflects the distribution of goods traded between China and Africa. It primarily includes commodity concentration, trade partner dispersion, and trade commodity dispersion. The China-Africa trade structure has shown continuous optimization. It fluctuated slightly between 95 and 115 from 2000 to 2014, rose to 129.92 in 2015, stabilized around 130 until 2019, and experienced another increase in 2020, surpassing 140 for three consecutive years and reaching its highest point of 143.69 in 2022.
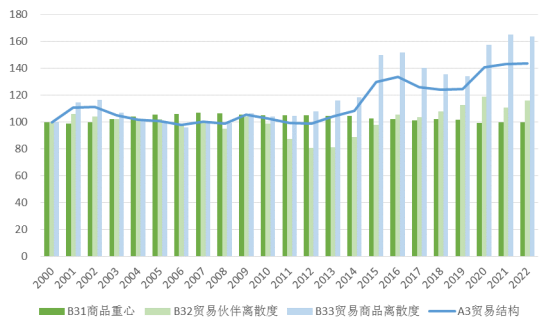
Trend Chart of Level 1 Indicators of Trade Structure
-
Trade Potential
- Trade potential reflects the development potential of the trade in goods between China and Africa, based on an analysis of the comparative advantages of China and Africa in trade. It mainly includes market capacity and investment cooperation. The trade potential index has consistently risen, reaching its highest value of 761.04 in 2022, with market capacity and investment cooperation indicators reaching 1007.44 and 155.09, respectively.
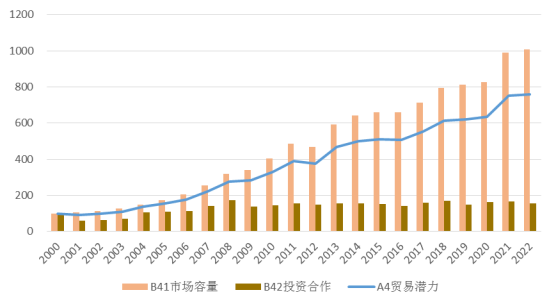
Trade Potential Level 1 Index Trend Chart
-
Subject Vitality
- Subject vitality reflects the development vitality of trade in goods between China and Africa. It primarily includes enterprise competitiveness and enterprise participation. The China-Africa trade vitality index has maintained a positive growth trend, reaching 833.11 in 2022. The enterprise competitiveness and enterprise participation indicators reached 137.74 and 983.72, respectively.
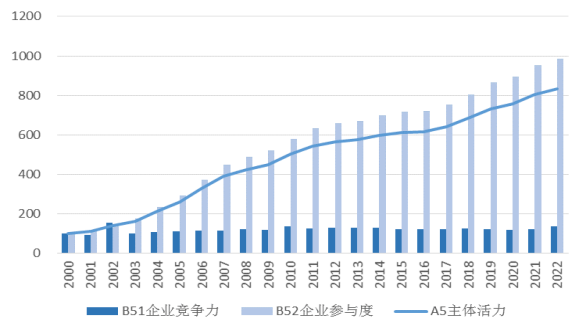
The trend chart of the first-level index of main body vitality


